The Round-Trip.
Coastal low-iron silica sand cost roughly the same in 2026 as it did in 2019. Everything else about the industry changed permanently. This report reconstructs what the capital bought — through 22 melters, 8 supplier countries, and 18 field photographs from a commodity trader's seven-year round-trip.
Six years of policy volatility
hidden inside a flat price.
Between January 2019 and August 2026, the delivered CIF price of low-iron silica sand into Chinese coastal PV-glass melters moved less than 8 % net. The trader who reads only the price sees a boring market. The trader who reads the underlying policy record sees six years of continuous structural adjustment: export-tax refund changes, tariff reciprocity actions, quota rewrites (RKAB), environmental audits, permit expirations, iron-ceiling revisions, and inland processing carve-outs. This report is the second kind of reading.
Executive summary — five things that changed
- Fe₂O₃ ceiling tightened from ~100 ppm to ~80 ppm for premium PV-glass float, driven by high-efficiency N-type module demand. This locked out several 2019-era domestic sources and pulled in Vietnam/Australia. Verified
- China's silica-sand export-tax refund path was closed for most HS 2505/2506 lines through 2023–2025 policy waves — outbound arbitrage that funded Chinese-origin sand in Southeast Asia disappeared. Desk
- Indonesia RKAB quota system tightened under 2024–2025 permitting reforms — silica-sand quota holders shrunk from a wide 401-permit pool (nickel-adjacent) to a much narrower silica-specific list. Legal export capacity fell before demand did. Desk
- Coastal Chinese PV-glass capacity concentrated into two clusters — Beihai (imports-friendly) and Fengyang-adjacent Yangtze delta (river-fed by 12 Mt/yr domestic base). The bifurcation is why national imports rise even as domestic supply exceeds national demand. Field
Fishbone · four policy causes, one price effect
Four policy tracks converge on one price effect. Each bone lists verified nodes except where marked as industry estimate. Acid-leaching timeline partly Field.
Policy timeline · 2019 – Aug 2026
Every event on this timeline moved either the tariff line, the permit stack, or the specification threshold. High-severity events (ferric red) shifted the delivered cost curve by >5 %; medium (gold) shifted >2 %; low (grey) mattered structurally but not for immediate cost.
Five demand pools,
one tightening spec.
China's silica-sand demand splits into five downstream pools. Each has a distinct iron-content threshold, price ceiling, and volume envelope. Reading them as one market — the way trade data does — obscures what actually moved between 2019 and 2026: two of the five pools tightened their specs, one collapsed, one exploded in size, and one detached entirely into a separate market.
The four pools
| Pool | 2025 vol | Fe₂O₃ ceiling | Delivered CIF | Structural direction 2019→2026 |
|---|---|---|---|---|
| PV-glass float Premium N-type module glass | 3.8 Mt | < 80 ppm | USD 42–58 /t | Spec tightened 100 → 80 ppm; volume up 3.4× vs 2019 |
| PV-glass float — legacy Bifacial / P-type / patterned | 1.2 Mt | < 120 ppm | USD 32–42 /t | Collapsing pool — replaced by N-type upgrade |
| Container / flat glass Automotive / architectural | 2.1 Mt | < 150 ppm | USD 26–34 /t | Stable pool; imports irrelevant, all domestic |
| Foundry / fracking Casting sand, prop-pack | 1.4 Mt | Iron irrelevant | USD 18–24 /t | Steady; no policy touch since 2020 |
The trader's takeaway: the top row (premium PV) is where all the import volume is going and where the freight-geometry story sits. Legacy PV is collapsing, container/flat is stable and domestic-supplied, foundry/fracking is untouched. All four pools trade against the same coastal RMB 250 anchor, but only premium PV moves the import order book.
PV-glass demand trajectory
Chinese PV-glass silica sand demand · Mt/yr · 2019–2026E
Solid = premium N-type < 80 ppm · Dashed = legacy P-type / bifacial < 120 ppm · Desk
Daily melting capacity · 2019–2026 (t/d)
Photovoltaic glass is produced by the rolling process, and silica-sand consumption runs at approximately 70 % of daily melting capacity. Fix that ratio and the entire demand history falls out of a single published series.
Blue bars: nationwide operating photovoltaic-glass daily melting capacity, tonnes per day. 2019–2023 year-end; 2024 mid-year peak; 2025 January; 2026 mid-year. Grey figures below: silica-sand demand derived at 70 % × 365 days, in million tonnes per year.
Peak operating capacity of 111,900 t/d in May 2024 implies sand demand of 78,330 t/d, or 28.6 Mt/yr. By mid-2026 operating capacity had fallen to 81,350 t/d, implying 20.8 Mt/yr. Roughly 7.8 Mt/yr of sand demand evaporated in twenty-five months — a 27 % contraction.
The overhang nobody prices — 11 Mt/yr of latent demand
Contraction alone would be a normal downcycle. The distinguishing feature of this one is what happened to the capacity that stopped running. As of Q1 2026, national nameplate PV-glass capacity stood at approximately 132,000 t/d against operating capacity of about 89,000 t/d, with roughly 43,000 t/d in cold repair or idled.
Idled furnaces represent approximately 11.0 Mt/yr of latent sand demand — larger than the entire demand base of 2021. It is not destroyed. It is a call option held by the glass industry against any price recovery, and its existence is why any sand-price recovery is self-limiting: firmer glass margins relight furnaces that lift sand supply requirements and cap the sand price at the same time.
The N-type module transition
The single biggest demand-side event of 2019–2026 was not module capacity growth — it was the shift from P-type PERC to N-type TOPCon and HJT cell architectures. N-type modules generate 2–3 % more power per watt of glass area, which sounds small until you compound it across a 1200-GW national target. To capture that gain, the glass has to hit < 80 ppm Fe₂O₃ consistently, not just on the spec sheet. This spec pull is what drove Vietnam Cam Ranh's volume up 4× between 2020 and 2025.
The interesting second-order effect: because N-type glass is thinner (1.6mm vs 2.0mm legacy) and requires higher iron-independence for the same thickness, per-module sand consumption fell ~ 12 %. But module count grew 3× over the same window. Net effect: sand demand grew, but slower than module capacity growth suggests.
Beihai · Fengyang · Zhanjiang
Three clusters, one freight geometry problem.
China's domestic silica-sand base is not one market — it is three distinct clusters with different resource types, different downstream customers, and different freight vectors. Understanding them individually is the only way to explain why national imports keep growing even as national capacity vastly exceeds national demand.
Beihai — one prefecture, three feed streams, nine PV majors
Beihai on China's southern Guangxi coast is the world's densest concentration of qualified PV-glass melting capacity. Nine majors sited on approval in 2022–2023: Xinyi Solar (信义) · Flat Glass (福莱特) · CSG (南玻) · Xinfuxing (新福兴) · Yijun Yaoneng (亿钧耀能) · Dejin (德金) · Changli (长利) · Dongfang Xiwang (东方希望) · plus one unnamed. Combined qualified capacity at end-2025: ~14 Mt/yr float glass.
Beihai has three feed streams: (1) local sea sand from Beibu Gulf, dredged year-round; (2) beach sand from Weizhou Island and mainland coastal deposits; (3) acid-washed mountain quartzite from inland Guangxi. Each has its iron profile. Sea sand is 95–110 ppm without acid wash; beach sand is 100–130 ppm; mountain quartzite runs 70–120 ppm depending on the seam. For < 80 ppm premium PV, imported blend is required for the majority of production.
Fengyang — the upstream mirror to Beihai
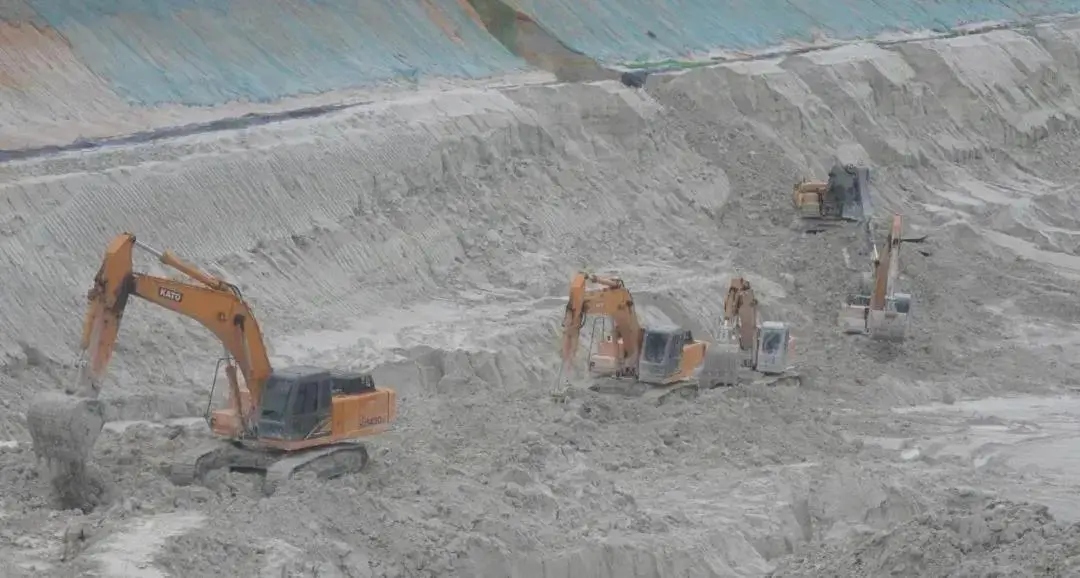
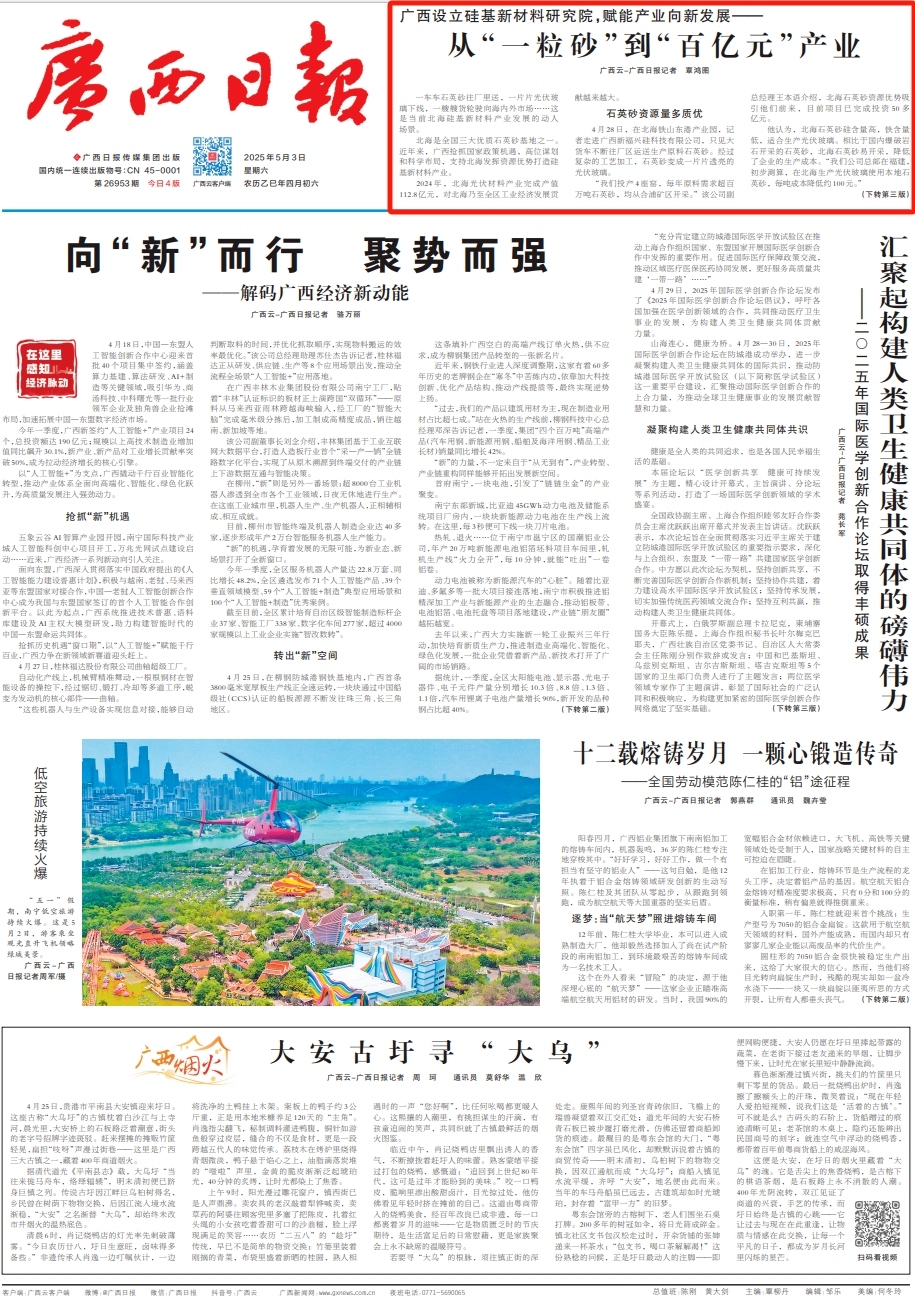
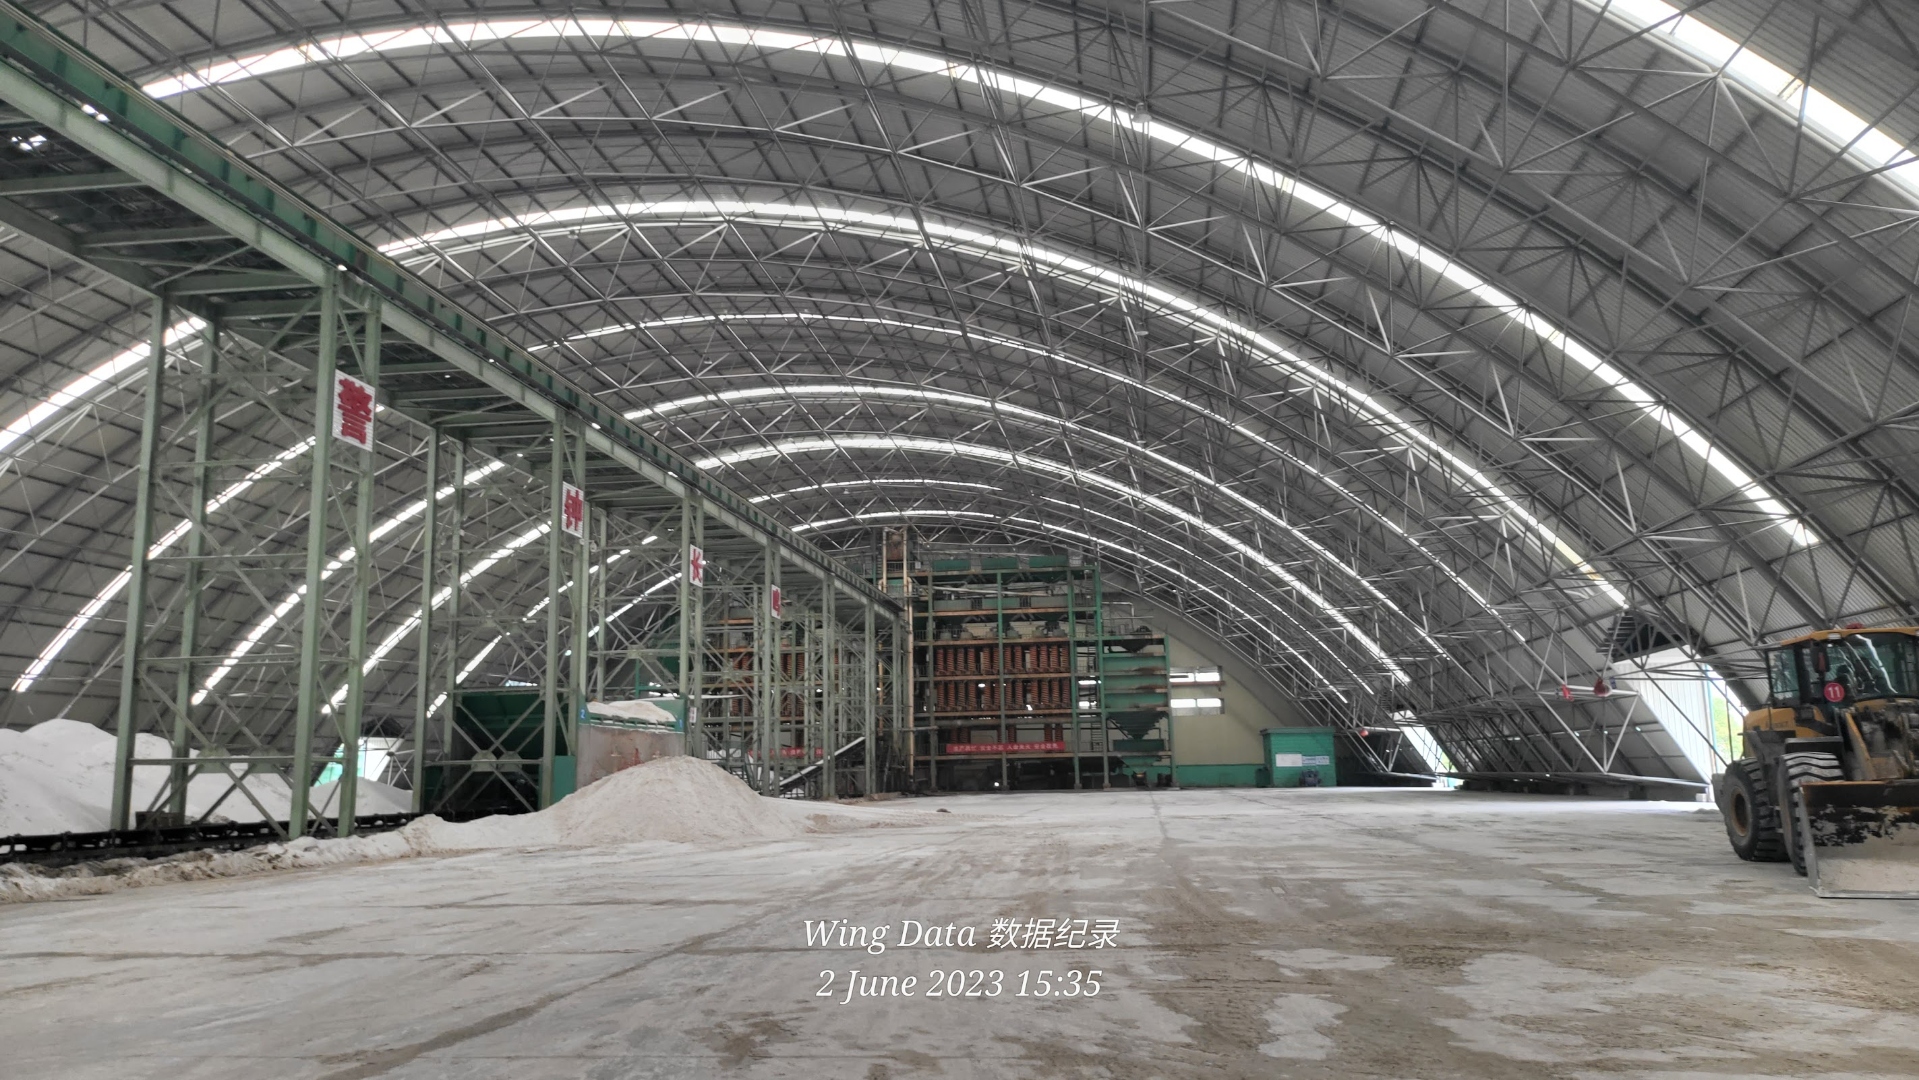
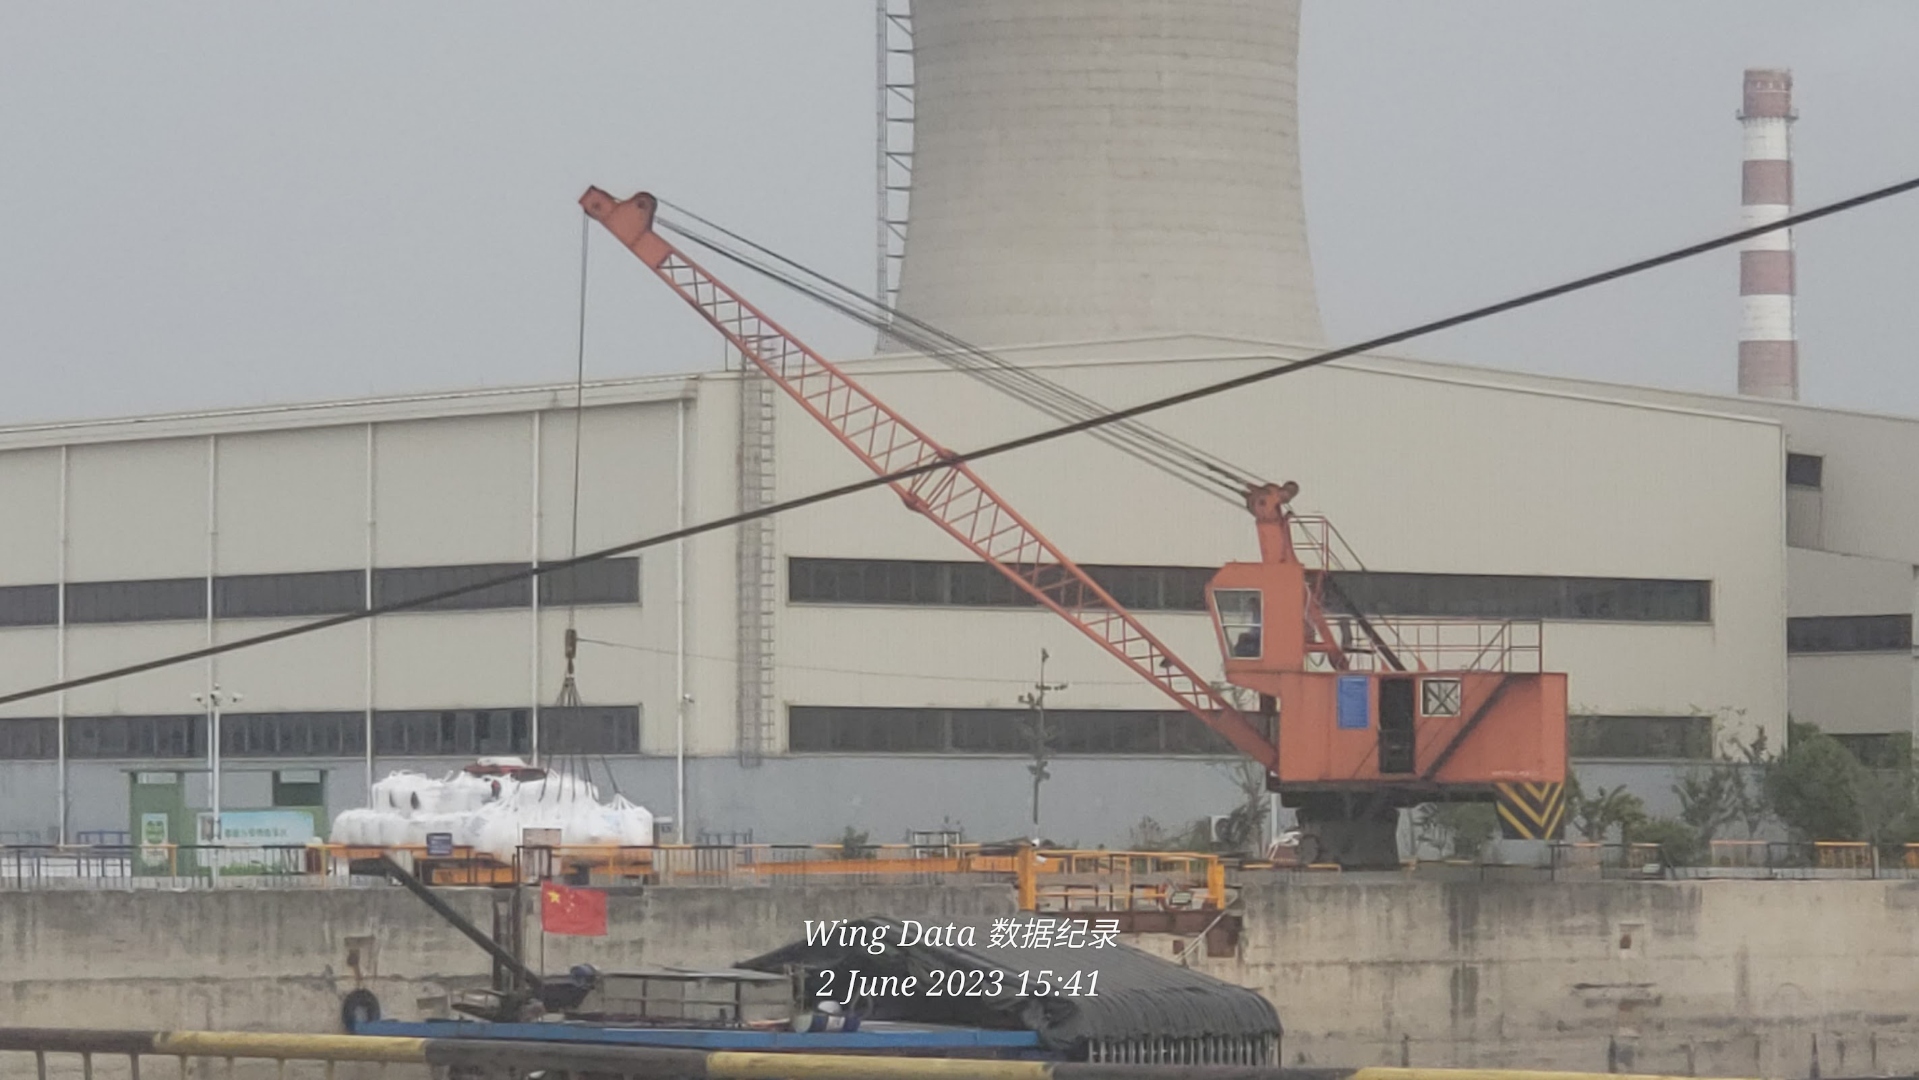
Fengyang County (凤阳县) in northern Anhui is China's largest single upstream silica-sand base. Wing's on-the-ground count as of Aug 2026:
Two numbers deserve attention. First, actual producible capacity is four times the on-paper number. The gap is not accounting error — it is the difference between what a permit says the operator may extract and what the operator's line can actually process when the market pulls. Second, the absolute size: 12 Mt/yr of Fengyang capacity alone is 2.4× the entire 2025 China silica-sand import volume (4.91 Mt). National imports do not exist because domestic supply is short. They exist because Fengyang's supply cannot economically reach the coast.
Zhanjiang — the kaolin coproduct route
Guangdong Zhanjiang is the least-visible piece of the domestic base and possibly the most strategic. Zhanjiang has two feed lines: (1) construction-sand upgrade — acid-washed local building sand that meets Fe < 100 ppm after processing; (2) kaolin coproduct silica — silica extracted as a by-product of kaolin (aluminium silicate clay) processing. The kaolin route delivers Fe < 80 ppm consistently after acid wash, the same threshold as premium imports, but starts from a domestic feedstock stream.
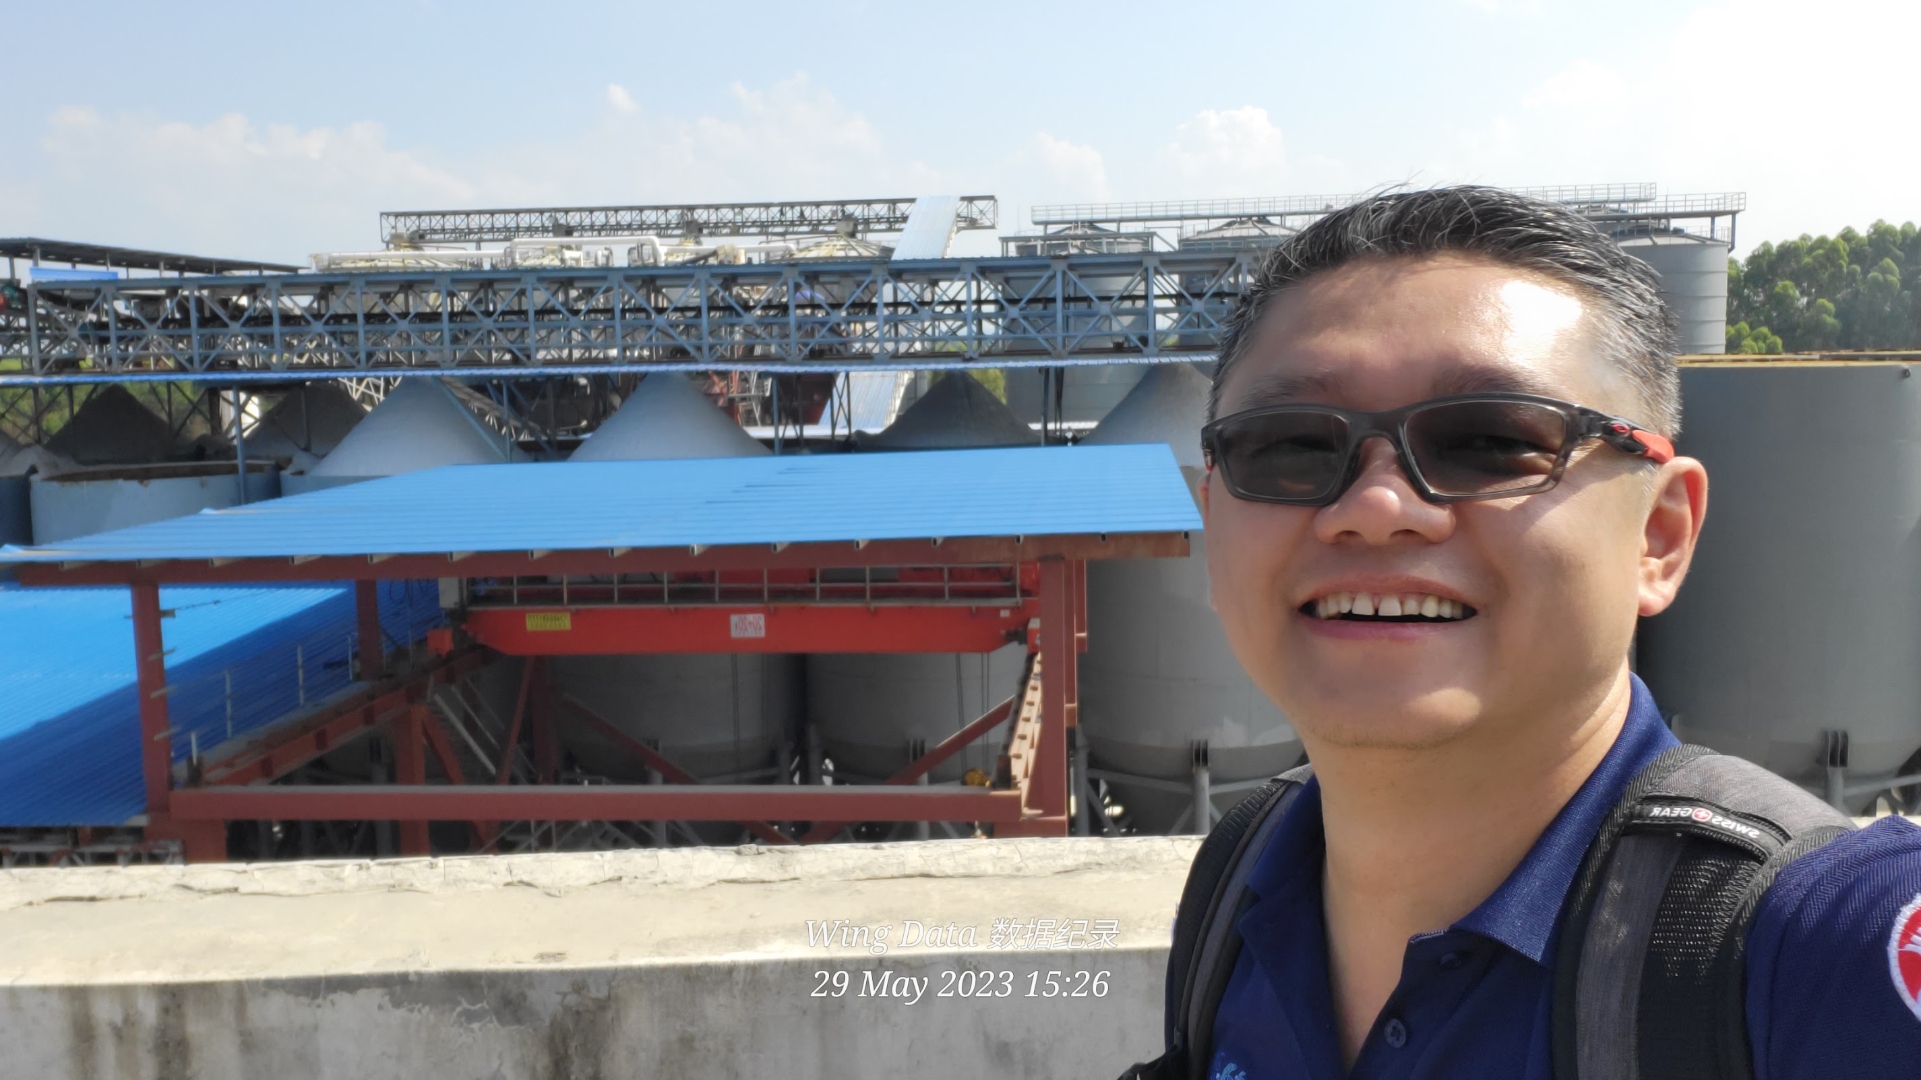
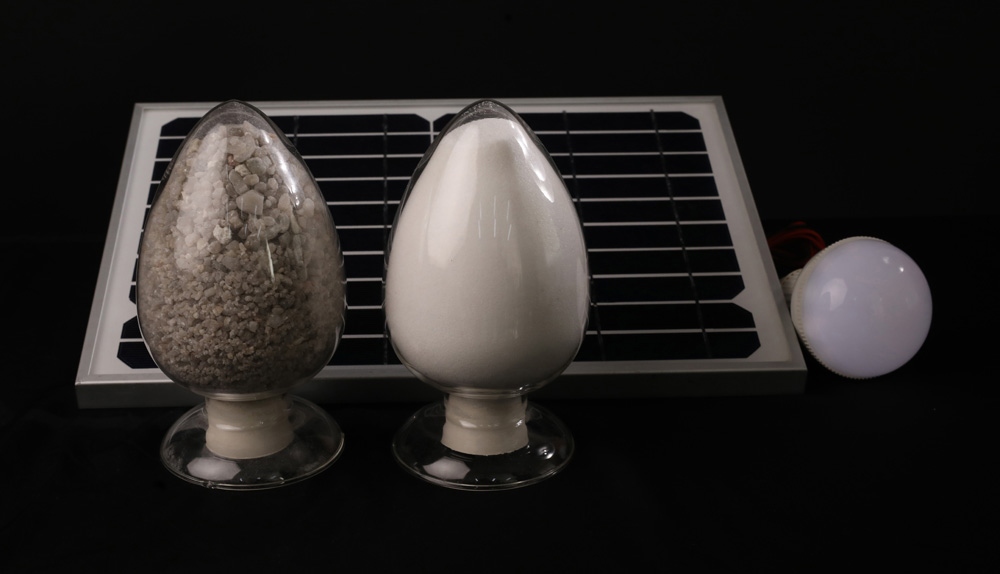
Both Zhanjiang streams route through the same coastal processor kit. The strategic point: this is a domestic route that meets the < 80 ppm premium spec without ocean freight, without Fengyang's inland freight, and without Beihai's local iron ceiling problem. Volume is not published, but Wing's field estimate is ~800 kt/yr as of 2026, growing.
Seven supplier countries.
One coastal-freight arbitrage.
China's 4.91 Mt of 2025 silica-sand imports came from seven material supplier countries. Four are the volume backbone (Vietnam, Malaysia, Australia, Indonesia). Three are secondary or wildcard origins (Egypt, Jordan, Guyana). Each has a distinct iron profile and permit regime.
Supplier country map
Country-by-country
#1 origin since 2024. Cam Ranh produces the lowest-iron export material south of Guangdong (< 60 ppm on the best seams). Export licence tightening in 2021 capped volume but did not close it. Vietnam is the structural coastal-adjacent premium supplier for Beihai.
#2 origin, previously #1 pre-2024. Kuantan is a mixed tin-tailings and sedimentary silica base — quality bimodal, with tin coproduct feed running higher iron. Suitable for legacy PV-glass and container/flat blends.
Structural premium supplier. Cape Flattery routinely delivers < 60 ppm — the lowest of any material-scale export origin. High freight cost (Queensland → Beihai ~ 6800 km ocean) is offset by the price premium premium melters pay for iron. Critical-minerals list inclusion in 2026 signals possible future restriction.
Volume dropped sharply after 2024 RKAB rewrite (silica-specific permits shrunk to ~40 operators) and 2025 5 % export tariff. Downstreaming policy (hilirisasi) redirects material to domestic float-glass build-out in Batang / Cilegon. Not a growth origin for China.
Wildcard-turned-secondary. Wing's field programme first sighted Egyptian lump silica landing in Beihai in Q3 2020 (COVID-era freight arbitrage). Volume grew as Beihai blend requirements broadened. Long freight leg (Suez → Beihai) but competitive on FOB and iron consistency.
Blend-only origin. Jordan's silica sits at the higher end of the iron range and is used as diluent in container / flat glass melts, not premium PV. Route through Aqaba → Suez → SE Asia. Volumes small but stable.
Wing's field note (2024): "Good quality, but very long distance." Trans-Atlantic + Pacific leg makes it a test-tonnage supplier, not structural. Only appears when Vietnam / Cape Flattery windows close.
Freight geometry — why Vietnam wins
Vietnam wins the origin race because its ocean leg to Beihai is 800–1400 km, versus Australia's 6800 km or Egypt's 12000 km. Australian sand competes on the strength of its iron content — 30–50 % below the Vietnamese premium. Egyptian sand competes on FOB accessibility and stable blend properties. The 2019–2026 concentration onto Vietnam is a coastal-freight arbitrage, not a quality decision.
Flat price, four phases,
furnace economics remade twice.
Between January 2019 and August 2026, delivered CIF silica sand into Beihai moved less than 8 % net. Inside that flat trajectory lie four distinct phases, each with a different marginal-supplier structure. The furnace-level economics of the downstream PV-glass melters were remade twice over the same window — once by the Fe₂O₃ spec tightening (2021–2023), once by fuel-cost and carbon-permit changes (2024–2026).
Silica-sand price · 2019–2026 · the round trip
Seven years. Zero net price change. The number that started the cycle is the number that ended it — but it went to RMB 560/t in 2022 and came back.
Coastal delivered, tax-inclusive, low-iron / refined grade, annual anchor points. 2019–2020 from Flat Glass Group (福莱特) research disclosures. 2021 from raw-ore + processing spread. 2022 peak RMB 560 May–September (trader record). 2023 from November low-iron main quote. 2024 October RMB 250–320. 2025–2026 from trader record.
Three-tier supply — why the floor sits where it does
A market where a meaningful share of supply comes from by-products does not clear the way a textbook supply curve says it should. The floor is not set by the marginal producer's cost — it is set by the handling cost of a by-product whose economics belong to a different commodity.
| Tier | Sources | Marginal cost | Behaviour when the sand price falls |
|---|---|---|---|
| 1 · By-product | Kaolin-associated sand; tin tailings; titanium-dioxide by-product sand | ≈ Zero — the parent mineral carries the cost | Does not withdraw. Keeps selling at any price above handling cost. Sets the floor. |
| 2 · Opportunistic | Construction sand from foundations and demolition; sea sand; river sand | Low, but externally driven | Volume tracks construction and dredging activity, not the sand price. Unpredictable rather than responsive. |
| 3 · Purpose-processed | Crushed and milled quartz rock (Fengyang, Anhui inland processors) | Real, with a defined floor | Withdraws first. This is the only tier that clears the way a textbook supply curve says it should. |
Four price phases · 2019–2026
Delivered CIF silica sand · Beihai · USD/tonne · Jan 2019 → Aug 2026
Premium spec (< 80 ppm Fe₂O₃) monthly average · Desk
| Phase | Window | Price range | Structural driver |
|---|---|---|---|
| Baseline | 2019-Q1 → 2020-Q1 | USD 40–46 | Pre-COVID equilibrium; Vietnam/Malaysia dominate; Fe₂O₃ ceiling at 100 ppm |
| COVID freight | 2020-Q2 → 2021-Q4 | USD 50–62 | Ocean freight surge doubles CIF; FOB flat; short-lived Egypt / Jordan entry as freight blend |
| Spec-pull tightening | 2022-Q1 → 2023-Q4 | USD 44–54 | Fe₂O₃ ceiling moves 100 → 90 → 80 ppm; Cape Flattery and Vân Đồn take share; legacy sources drop out |
| Volume flood + tariff response | 2024-Q1 → 2026-Q3 | USD 40–50 | 2024 imports +52 % on 2023; Indonesia RKAB rewrite and 5 % tariff (2025) reset marginal cost; Vietnam captures dominant share |
Furnace economics — the invisible remake
PV-glass float melters run continuous 24/7 furnaces at ~ 1550 °C, with campaign lives of 8–12 years. Melt-cost economics have three main line items: (i) sand + soda ash + dolomite feedstock, (ii) natural gas / heavy fuel oil energy, and (iii) refractory / labour / carbon-permit overhead. The 2019–2026 window saw silica cost stay effectively flat while the other two lines moved substantially.
PV-glass melt cost structure · USD/tonne float glass output · Beihai reference melter
Stacked: sand + soda ash + fuel + carbon + refractory/labour · Desk
Two lessons for the sand trader. First, the sand cost per tonne of finished glass is roughly USD 18–22, or 15–20 % of total melt cost — small enough that a 10 % move in sand price shifts total glass economics by only 1.5–2 %. This is why silica sand is a relatively low-elasticity input: buyers care about iron consistency and delivery reliability more than about the absolute price. Second, fuel and carbon costs have moved 40 % over the same window while sand moved 7 %. If you want to predict PV-glass margin, look at natural gas, not sand.
Two furnace-level events that mattered
2022 Beihai qualification wave. Nine PV-glass majors qualified for coastal siting in a single 18-month window. This concentrated national demand geographically and made Beihai the world's densest premium float capacity. Sand cost as a share of local melter economics fell (freight leg to buyer is now zero) but iron-consistency cost rose (local sea sand at 95–110 ppm requires import blend).
2024–2025 natural gas re-pricing. Domestic LNG import benchmark rose ~ 30 %, and coastal carbon-permit prices tripled off a low base. Together they lifted total PV-glass cash cost by USD 8–12 / tonne finished glass. Sand contribution to this cost move: zero. Sand traders who thought melter margin compression would translate into sand price pressure discovered the elasticity math the hard way.
15 PV-glass melters.
One coastal-arc geography.
The demand side of China's silica-sand market is 15 named PV-glass float melters, most co-located in Beihai on the southern Guangxi coast, with a smaller Yangtze-delta cluster. The map below shows their coastal-arc distribution; the register table lists each with its 2025 capacity and location. This is the roster that every supplier country's tonnage ultimately serves.
Factory map · 22 facilities
PV-glass melter register (Beihai + Yangtze delta)
| Operator | Location | Capacity | Product | Notes |
|---|---|---|---|---|
| Xinyi Solar 信义光能 | Beihai · Guangxi | 2400 t/d | N-type float | 0968.HK · largest single melter in Beihai cluster |
| Flat Glass 福莱特 | Beihai · Guangxi | 2200 t/d | N-type + patterned | 601865.SH · 6607.HK · dual-listed |
| CSG 南玻 | Beihai · Guangxi | 1600 t/d | N-type float | 000012.SZ · state-linked |
| Xinfuxing 新福兴 | Beihai · Guangxi | 1200 t/d | Container + PV blend | Private · flexibility feed |
| Yijun Yaoneng 亿钧耀能 | Beihai · Guangxi | 1200 t/d | PV float | Private · Hubei parent |
| Dejin 德金 | Beihai · Guangxi | 1000 t/d | Rolled PV | Private |
| Changli 长利 | Beihai · Guangxi | 1200 t/d | PV + auto | Private · Yangtze co-plant |
| Dongfang Xiwang 东方希望 | Beihai · Guangxi | 1200 t/d | PV float | Private · agri-industrial group |
| Beihai #9 (unnamed) | Beihai · Guangxi | ~ 1000 t/d | PV float | Announced 2024, not yet public |
| Almaden Optical 亚玛顿 | Zhejiang · Changzhou | 900 t/d | Anti-reflective float | 002623.SZ |
| Irico 彩虹 | Anhui · Hefei | 1200 t/d | PV + display | 0438.HK |
| Yake 亚科 | Anhui · Wuhu | 800 t/d | PV float | 002409.SZ |
| Kaisheng 凯盛 | Anhui · Bengbu | 1000 t/d | PV + auto | 600552.SH · state-linked |
| Yangtze-adjacent #14 | Jiangsu · Suzhou | ~ 900 t/d | Container + PV | Private |
| Yangtze-adjacent #15 | Zhejiang · Ningbo | ~ 800 t/d | PV rolled | Private |